
Youth vaping rates higher in Australia than other countries
Posted on May 5, 2024 By Colin
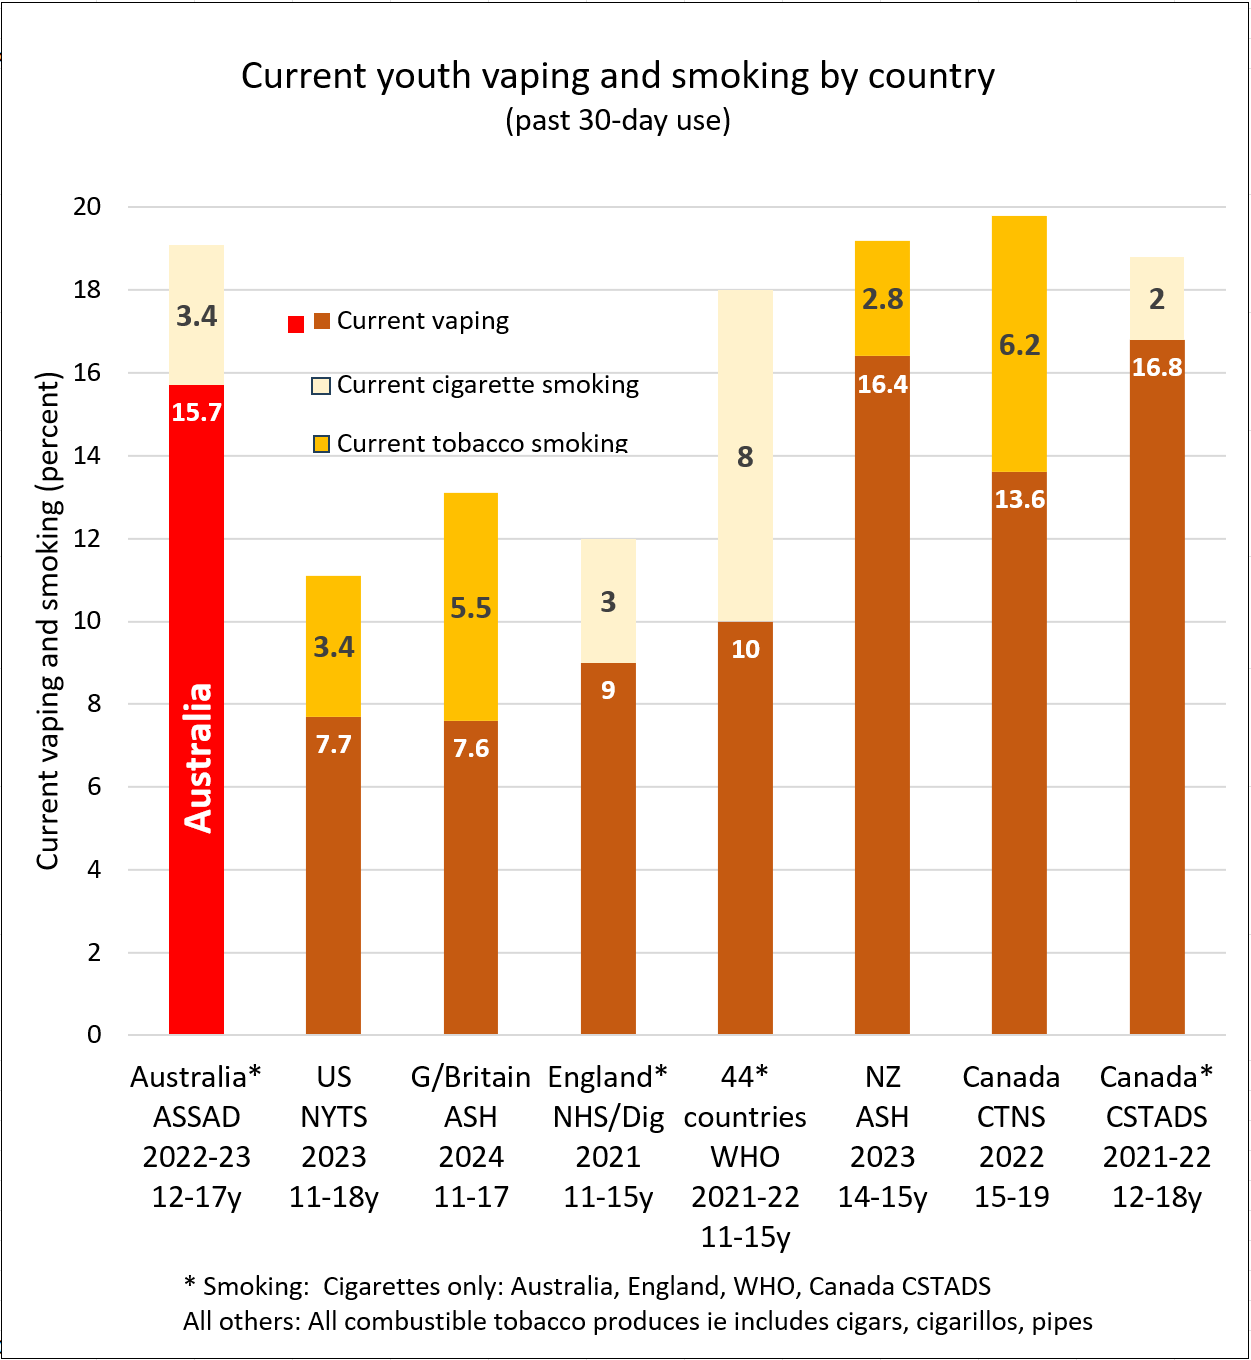
AUSTRALIA'S HARSH DE FACTO PROHIBITION of vapes has failed to reduce youth access. The youth vaping rate in Australia is higher than in most other countries where vaping is regulated as an adult consumer product.
A review of current youth vaping rates in nearly 50 countries is summarised in the following graph (vaping in brown, cigarette smoking light yellow, all smoking in dark yellow):
See the bottom of the page for study details*.
If Australia switched from the prescription-only regulations to an adult consumer model, it would make legal vapes more readily available for adults and reduce the black market which is supplying young people.
International trends
Youth vaping continues to rise sharply in Australia.
In contrast, youth vaping is declining in the US, Canada and New Zealand and has plateaued in Great Britain.

- In the US, current youth vaping declined by 61% in 4 years, from 20% in 2019 to 7% in 2023
- In Canada, current youth vaping declined by 15.8% from 20.2% in 2019 to 16.8% in 2022
- In New Zealand, regular youth vaping declined by 19%, from 20.2% in 2021 to 16.4% in 2023
- In Great Britain, current youth vaping is plateauing over 2023-24
- In England, current youth vaping was still rising in 2021
What about youth smoking?
Current smoking rates across all countries are at historical lows, as shown in the graph (in yellow), ranging from 2-3.4%. Part of this decline is due to diversion of youth to vaping and away from smoking.
Daily smoking has almost disappeared and ranges from 0.3% in Australia (ASSAD) to around 1% in the other countries, except in the Europe/Central Asian region.
Implications for policy
Australia’s de facto prohibition of vaping is driven by a moral panic about youth vaping but has not been effective in restricting youth uptake which continues to rise
The harsh restrictions have also created a range of serious unintended consequences
- Black market. They have also created a world leading rampant black market which supplies about 90% of users with unregulated products. In comparison, New Zealand (Submission 106) has no significant black market. In the UK, the black market is estimated to be around one third. In the US where the vast majority of products currently used have been banned by the FDA, an estimated half the market is illicit.
- Adult access. Access to vapes for adult smokers is severely restricted by requiring a doctor’s prescription and purchase from a limited range from pharmacies
- Lost taxation revenue. Billions of dollars of tax revenue and other economic benefits are unavailable from the current prescription-only model.
The benefit of legalising and regulating the sale of vapes as adult consumer products sold from licensed retail outlets has never been clearer. It would reduce youth vaping, give easier access to adult smokers, reduce the black market and generate government revenue.
Footnotes
* Studies included
The most recent and largest official youth surveys in Australia, the US, England, New Zealand and Canada:
- Australia: ASSAD, n=10,065
- USA: NYTS, n=22,069
- England: NHS Digital, n=9289
- Great Britain: ASH UK (details TBA)
- New Zealand: ASH Year 10 Survey, n=29,260
- Canada: CSTADS n=61,096
A large survey by the World Health Organisation published in April 2024 from 44 countries in Europe, Central Asia and Canada (data collection 2021-2022), n=279,117
- HBSC (WHO): Albania; Armenia; Austria; Belgium (Flemish); Belgium (French); Bulgaria; Canada; Croatia; Cyprus; Czechia; Denmark; Denmark (Greenland); Estonia; Finland; France; Greece; Hungary; Iceland; Ireland; Italy; Kazakhstan; Kyrgyzstan; Latvia; Lithuania; Luxembourg; Malta; Netherlands (Kingdom of the); North Macedonia; Norway, Poland; Portugal; Republic of Moldova; Romania; Serbia; Slovakia; Spain; Sweden; Switzerland; Tajikistan; United Kingdom (England); United Kingdom (Scotland); and United Kingdom (Wales).
Note that direct comparisons between the surveys can’t be made as they use different age ranges, definitions and are taken at different times.
Exclusions
These studies were not included due to small sample sizes:
- Australia: NDSHS 2022-23, n=560
- New Zealand: New Zealand Health Survey 2022-23, n=192